
Optimizing Ambulatory Operations: A Data-driven Approach to Enhanced Performance and Strategic Growth
The landscape of healthcare is undergoing a significant transformation, with ambulatory care emerging as a …

Ambulatory care sits at the intersection of clinical excellence and financial sustainability—and increasingly, the margin for success lies in how well organizations can read and respond to their own data. While clinical outcomes remain paramount, the ability to track, measure, and act on key financial and operational indicators is what separates thriving systems from those merely treading water. From referral patterns to reimbursement trends, the right metrics can uncover powerful insights that drive both improved patient experiences and stronger bottom lines.
In Part 1 of the blog series on the critical role of ambulatory operations dashboards, we explored the operational side of ambulatory performance. Specifically, we examined how data dashboards enhance visibility into patient access, appointment management, and day-to-day efficiency.
In this second installment, we explore the essential financial metrics and dashboards that give ambulatory leaders the visibility they need. These tools help optimize care delivery, reduce revenue leakage, and align teams around shared performance goals. It’s not just about reporting the numbers—it’s about using them to build a smarter, more responsive, and ultimately more resilient ambulatory enterprise.
Explore:
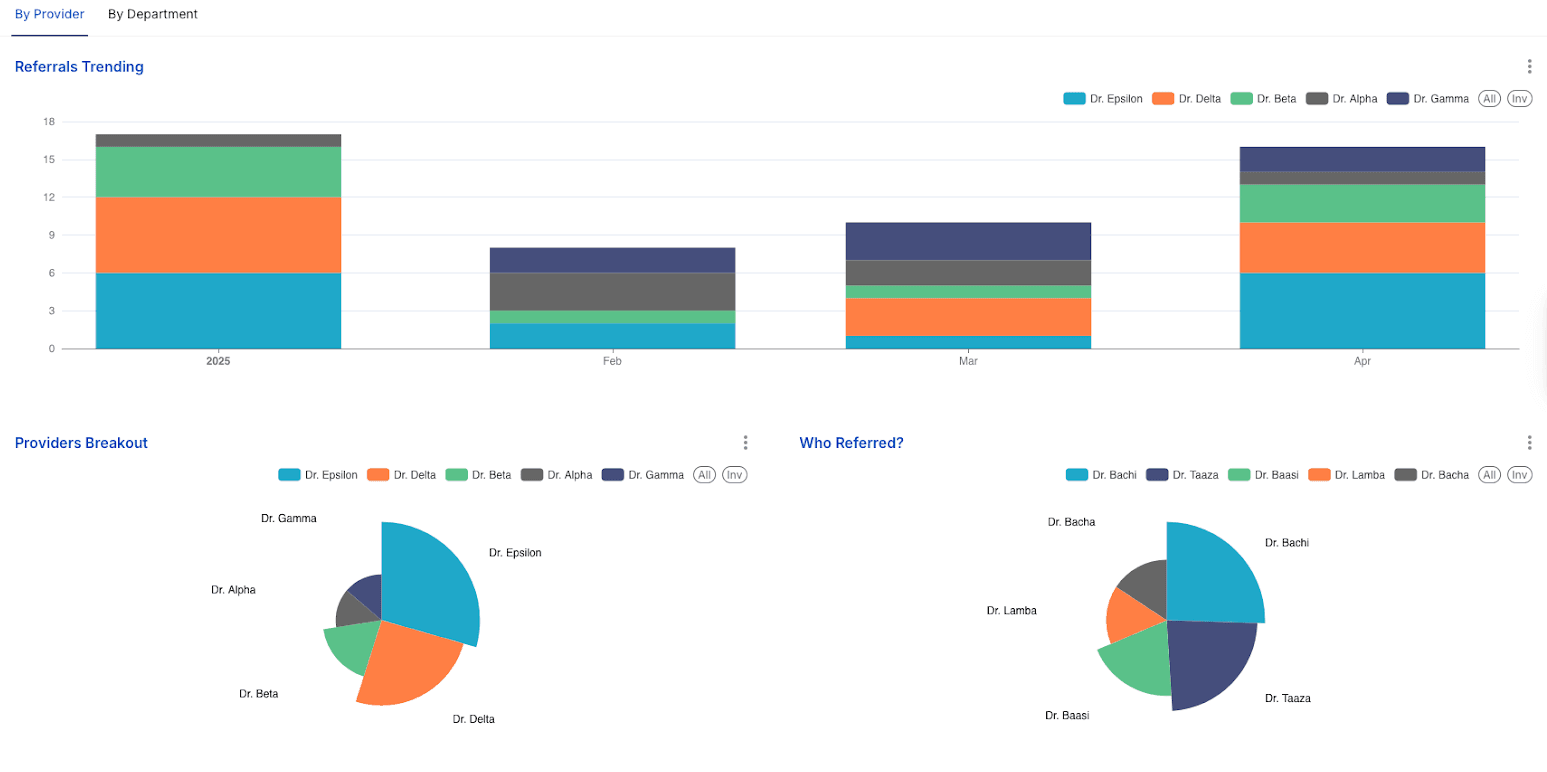
Referral management is a cornerstone of integrated healthcare delivery, impacting care coordination, patient experience, and financial performance. Effective tracking and analysis of referral patterns are essential for ambulatory networks.
Analysis of Core Metrics
Analytical Insights
Case Studies
The analysis of referral patterns, particularly concerning out-of-network referrals, can offer insights that go beyond simple patient preference or insurance plan mandates. If specific in-network specialists or departments are consistently bypassed by internal referrers in favor of external options, it may signal underlying provider perceptions about the quality of care, the timeliness of consultation reports, the ease of communication, or, critically, the appointment availability (i.e., long lead days) of those in-network options. This phenomenon represents a form of "internal leakage" that is driven by the referring providers' own experiences and perceptions. Provider satisfaction with factors like rapid report turnaround times from specialists is known to influence their referral choices. Consequently, a high rate of internal leakage to external providers, despite formal network affiliations, should prompt a qualitative investigation into the root causes. Such an investigation might uncover correctable issues with specific in-network specialists or departments that are currently hindering network integrity and leading to lost revenue and fragmented care.
Although the dashboard tracks referral volume, it doesn't assess clinical appropriateness. Many referrals are inappropriate, leading to wasted resources, extra costs, and delayed care. This is a significant consideration, as research indicates that a substantial number of physician referrals—19.7 million annually in the U.S.—may be clinically inappropriate. Furthermore, studies suggest that as much as 26.2% of all referrals could be classified as potentially inappropriate. Auditing referral appropriateness, especially in high-volume pathways, can improve efficiency and reduce costs.
While referral volume is important, referral processing time is crucial but often overlooked. Delays, poor communication, or scheduling difficulties can cause patient frustration and referral abandonment, hindering care and revenue. Optimizing the internal referral process—speed, communication, and scheduling—is as vital as managing external referral leakage. High processed referral numbers may hide significant patient drop-off due to inefficient workflows.
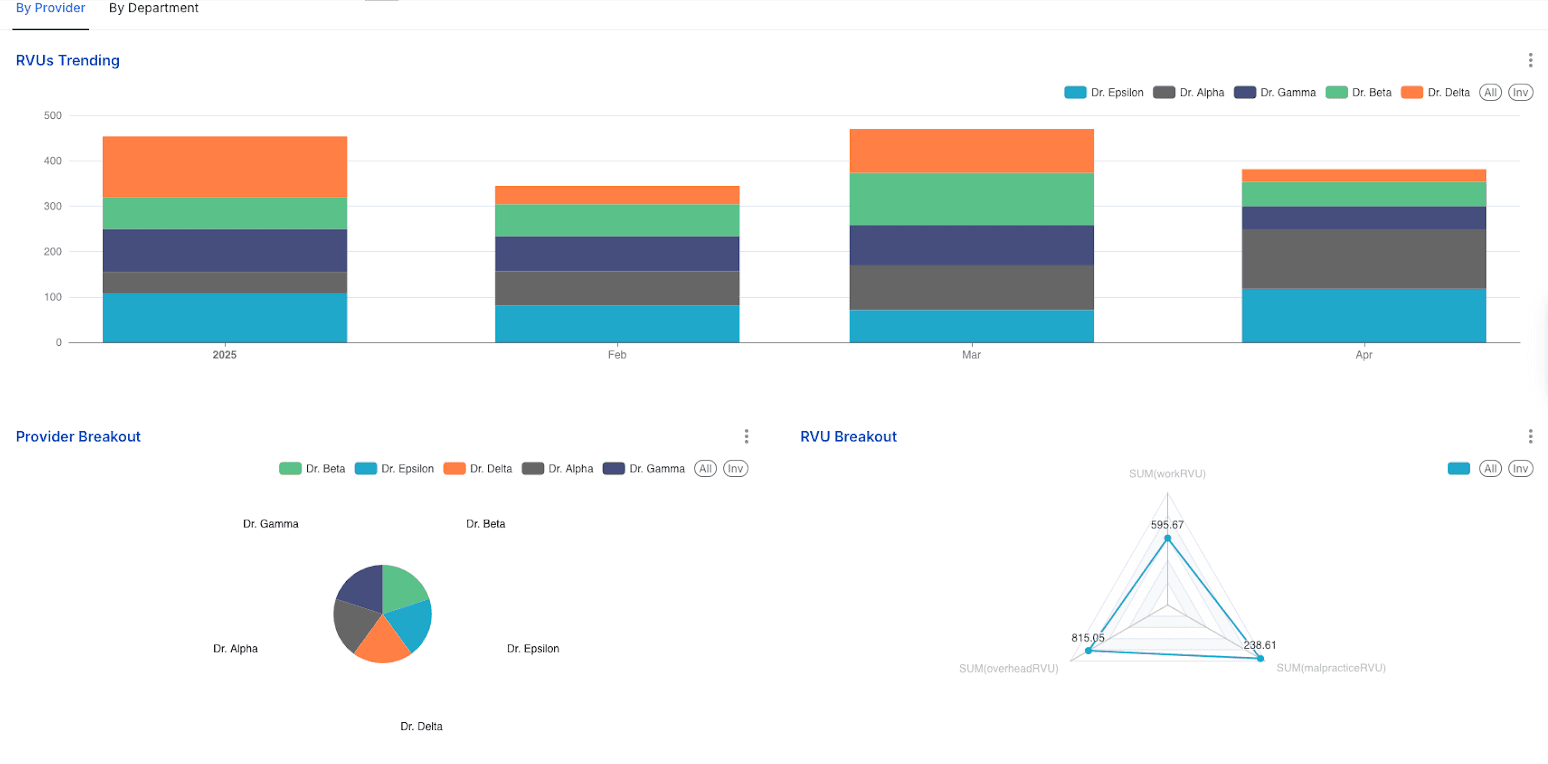
Relative Value Units (RVUs) and associated financial metrics are fundamental to understanding provider productivity, practice efficiency, and overall financial health in ambulatory care. This section explores how these metrics can be analyzed and leveraged.
Analysis of Core Metrics
Analytical Insights
RVU analysis is indispensable for robust performance management, designing equitable physician compensation plans, and gaining a clear understanding of the economic drivers within the ambulatory practice.34 The relationship between charges and RVUs is complex, primarily because charges set by the practice are not typically what is reimbursed by payers. The most critical financial insights emerge from understanding the cost per RVU and the reimbursement per RVU, as these figures directly determine the profitability of services. Several factors can be managed to increase wRVU generation, including optimizing patient visit volume, ensuring accurate and appropriate Evaluation & Management (E/M) coding levels, strategically focusing on high-value visits (such as new patient encounters, procedural services, and Medicare annual wellness visits), and effectively managing appointment lengths and scheduling templates to maximize provider time.
Case Studies
A more nuanced understanding of provider productivity emerges when analyzing it in conjunction with the patient mix and the types of visits conducted. For instance, a provider who sees a high volume of new patients, as defined by CPT codes, should theoretically generate a higher average number of wRVUs per visit. This is because new patient E/M codes generally carry higher wRVU values than those for established patients. If a provider has a significant new patient mix but their average wRVU per visit remains low, it could be an indicator of potential under-coding, insufficient clinical documentation to support higher-level codes, or perhaps that the "new" patients, despite being new to the practice, do not present with sufficient complexity to warrant higher-level E/M services. Conversely, a provider who manages a panel of mostly established patients, but with a high degree of medical complexity requiring extensive management, might demonstrate high wRVUs per visit despite a comparatively lower total patient volume. Thus, evaluating wRVUs per provider or department alongside their specific patient demographic mix and the distribution of visit types (e.g., E/M levels, specific procedures) provides a richer, more context-aware perspective on productivity than simply looking at total RVUs or total patient numbers in isolation. This multi-faceted analysis helps to distinguish between productivity driven primarily by patient volume and productivity driven by the complexity of care delivered.
While wRVUs are key for measuring physician productivity, PE and MP RVUs also impact reimbursement and departmental profitability. High PE or MP RVU departments need sufficient wRVUs to cover costs. Strategic decisions must consider all RVU components and reimbursement, not just wRVUs, for accurate financial planning.
Table 3: RVU Components and Their Strategic Importance
| RVU Component | Definition (Summarized from) | Typical % of Total RVU (Approx.) | Key Operational Driver | Strategic Relevance |
| Work RVU (wRVU) | Physician's time, skill, mental effort, judgment, and stress related to patient risk for a service. | 50-52% | Physician time, clinical skill, efficiency, and documentation | Provider productivity measurement, Compensation models, Service intensity analysis |
| Practice Expense (PE) RVU | Non-physician labor, clinical supplies, medical equipment, and office overhead (rent, utilities). Has non-facility/facility components. | 43-45% | Staffing efficiency, Supply cost management, Facility utilization | Overhead cost control, Profitability analysis by site of service, Investment decisions |
| Malpractice (MP) RVU | Cost of professional liability insurance, reflecting the relative risk of the service. | 3-5% | Risk profile of specialty, Tort environment | Risk management, Insurance negotiation, Specialty service, financial planning |
The true power of ambulatory operations dashboards lies not just in tracking individual metrics but in their ability to provide an integrated, holistic view of performance, driving improvements across patient care, operational efficiency, financial health, and strategic growth.
Synthesizing the Utility: How Integrated Metrics Provide a Holistic View of Operations
Ambulatory operations dashboards serve as a central nervous system for the practice, consolidating data from disparate sources such as Electronic Health Records (EHRs), billing systems, and scheduling platforms into a unified, accessible interface. This integration is crucial because it allows for the visualization of Key Performance Indicators (KPIs) in a way that reduces the time staff spend on manual data collection and lessens the cognitive load associated with interpreting fragmented information. With the capability to display clinical, financial, and operational activity in one cohesive view, often incorporating over 100 pre-configured measures relevant to ambulatory settings, these dashboards enable leadership and staff to understand critical interdependencies. For example, they can clearly see how appointment lead times directly influence no-show rates, which subsequently impact provider utilization and the overall generation of Relative Value Units (RVUs). This interconnected perspective is vital for making well-informed, system-wide improvements.
Connecting Dashboard Insights to Improved Patient Outcomes, Enhanced Operational Efficiency, and Stronger Financial Health
The insights gleaned from these dashboards have a direct and measurable impact on the core pillars of healthcare success:
The Role of Dashboards in Strategic Planning and Growth for Ambulatory Care Networks
Ambulatory operations dashboards are essential for strategic planning and growth, providing data-driven insights into trends, capacity, and market relevance. They unify metrics from various departments, fostering collaboration and breaking down silos. By revealing interdependencies, dashboards highlight how small inefficiencies create cumulative "operational drag," impacting patient flow, productivity, and satisfaction. This quantification enables data-backed improvement initiatives, moving beyond assumptions. Furthermore, these dashboards are vital for value-based care models, offering crucial metrics on access, referrals, RVU generation, and patient satisfaction, allowing organizations to monitor and improve performance for success in a value-driven healthcare environment.
To maximize the value derived from ambulatory operations dashboards and ensure sustained success, organizations should consider the following recommendations:
The journey of leveraging data in ambulatory care can be conceptualized as an "analytics maturity journey." This progression typically starts with basic descriptive analytics, which focuses on understanding "what happened" (e.g., reporting monthly patient volume or historical no-show rates). The next stage is diagnostic analytics, which aims to determine "why it happened" (e.g., identifying that high no-show rates are correlated with long appointment lead times). As capabilities mature, organizations move towards predictive analytics, which seeks to forecast "what will happen" (e.g., projecting future appointment demand based on historical trends and seasonality, or predicting the likelihood of individual patients missing appointments). The most advanced stage is prescriptive analytics, which provides recommendations on "what should we do" about the predicted outcomes (e.g., automatically optimizing provider schedules based on demand forecasts and no-show predictions, or suggesting targeted interventions for high-risk patients). The current ambulatory operations dashboard likely provides strong capabilities in descriptive and some diagnostic analytics. The future direction for maximizing the strategic value of such dashboards involves a conscious and strategic effort to advance along this maturity curve, investing in the necessary tools, technologies, and staff skills to harness the power of predictive and prescriptive analytics. This evolution will unlock greater strategic foresight and enable more impactful, proactive decision-making.
As ambulatory practices become increasingly sophisticated in their use of data and analytics—employing AI-driven scheduling, complex risk stratification algorithms, and personalized outreach—ethical considerations surrounding data privacy, algorithmic bias, and equitable access to care become paramount. For instance, an algorithm designed to optimize provider schedules purely for maximum RVU generation could inadvertently disadvantage patients with complex, time-consuming chronic conditions if not carefully designed and monitored, as these patients might require longer, less "productive" (in terms of RVUs per minute) appointment slots. Similarly, predictive models for no-shows or readmissions, if based on biased historical data, could unfairly penalize certain patient populations. Therefore, alongside technological advancements, healthcare organizations must develop and adhere to strong ethical frameworks and robust data governance policies. These frameworks must ensure that efficiency gains and operational optimizations do not come at the cost of patient well-being, exacerbate existing health disparities, or compromise patient trust. This includes maintaining transparency with patients about how their data is being collected, used, and protected, and ensuring that automated decision-making processes are regularly audited for fairness and accuracy.
The comprehensive analysis of the Ambulatory Operations dashboard metrics underscores their profound utility in navigating the complexities of modern healthcare. These indicators, ranging from patient volume and appointment management to referral patterns and RVU financials, are not merely data points; they are vital signs reflecting the health and performance of an ambulatory practice. When systematically tracked, analyzed, and acted upon, they empower healthcare organizations to enhance patient access, improve operational efficiency, strengthen financial viability, and ultimately, deliver higher quality care.
The success stories and anecdotes presented through this article vividly illustrate that data-driven decision-making is not an abstract concept but a practical pathway to tangible results. Organizations that have embraced analytics have successfully reduced patient wait times, optimized provider schedules, turned around challenging financial situations, reduced costly no-shows and referral leakage, and improved both patient and staff satisfaction. These achievements are often the result of a holistic approach, recognizing the interconnectedness of various operational facets and leveraging integrated data to identify and address root causes rather than just symptoms.
The deeper connections explored—such as the link between appointment lead times and no-show rates, the impact of provider burnout on overall productivity, the importance of qualitative factors alongside quantitative measures, and the critical role of payer mix and cost-per-visit analyses—reveal that a superficial reading of dashboard data is insufficient. True operational intelligence emerges from understanding these nuanced relationships and their broader implications for strategic planning and value-based care.
Looking ahead, the continued evolution of ambulatory analytics, driven by AI, real-time data integration, and a greater focus on patient-centricity and SDoH, promises even more powerful tools for ambulatory leaders. However, realizing this potential requires more than just technology; it demands a commitment to fostering a data-driven culture, investing in staff capabilities, ensuring robust data governance, and navigating the ethical considerations inherent in advanced data utilization.
By diligently leveraging the insights provided by comprehensive operations dashboards and embracing a culture of continuous, data-informed improvement, ambulatory care organizations can not only address current challenges but also proactively shape a future characterized by operational excellence, financial sustainability, and superior patient outcomes. The journey towards a thriving ambulatory future is unequivocally paved with data.
Join over 3,200 subscribers and keep up-to-date with the latest innovations & best practices in Healthcare IT.
The landscape of healthcare is undergoing a significant transformation, with ambulatory care emerging as a …

The global personalized medicine market size was valued at USD 538.93 billion in 2022 and is projected to …

Data warehousing in healthcare is an increasingly important tool to collect, store, and analyze the massive …