
The Essentials of Migrating to a new EHR Application
Migrating to a new Electronic Health Record (EHR) system is a critical decision for healthcare organizations …

The landscape of healthcare is undergoing a significant transformation, with ambulatory care emerging as a focal point for growth and innovation. Projections indicate a substantial increase in outpatient evaluation and management visits, estimated at 15.4% over the next decade. This expansion underscores the critical need for sophisticated data analytics to manage operations effectively and ensure sustainable success. The ongoing shift towards value-based care models further amplifies the necessity for data-driven strategies within ambulatory settings, compelling organizations to demonstrate quality and efficiency.
This article is the first installment in a two-part blog series exploring the critical role of ambulatory operations dashboards. In this first part, we focus on the operational aspects—how dashboards provide visibility into patient access, appointment management, and key performance indicators (KPIs) to enable strategic growth and performance improvement.
Ambulatory operations dashboards are pivotal in fostering data-driven decision-making, which is fundamental to achieving operational excellence. By providing a condensed, visual representation of KPIs, these dashboards simplify the interpretation of complex data, allowing stakeholders to quickly grasp progress, identify challenges, and obtain a high-level overview of facility operations. The core benefits are multifaceted: they facilitate enhanced access to and understanding of data by summarizing and visualizing critical information that demands immediate attention; they enable the prediction of trends through graphic views of performance against benchmarks over time, allowing leadership to proactively adjust strategies; and they assist in prioritizing actions by displaying essential data rolled up into overarching goals, thereby clarifying how detailed metrics influence strategic objectives. Ultimately, well-designed dashboards contribute to improved care quality, reduced costs, an enhanced patient experience, and greater provider engagement.
Furthermore, the implementation of a comprehensive ambulatory operations dashboard is more than a technological upgrade; it signifies and mandates a profound cultural shift towards data-centric decision-making across all organizational levels.
The effective utilization of these dashboards hinges on robust staff engagement, comprehensive training in data interpretation, and a leadership team that actively champions transparency and accountability. Without this cultural alignment, even the most sophisticated dashboard can be rendered ineffective by resistance to change or prevalent data illiteracy. Consequently, successful dashboard deployment necessitates a concurrent investment in change management initiatives, targeted staff training programs, and the cultivation of an organizational culture where data serves as a common vernacular for problem-solving, continuous improvement, and strategic dialogue. This includes reinforcing daily operational practices, such as team huddles, with digital tools and shared dashboards to ensure data is consistently integrated into routine workflows and discussions.
Explore:
I. Decoding Patient Access and Volume Dynamics
II. Mastering Appointment Management for Efficiency and Patient Satisfaction
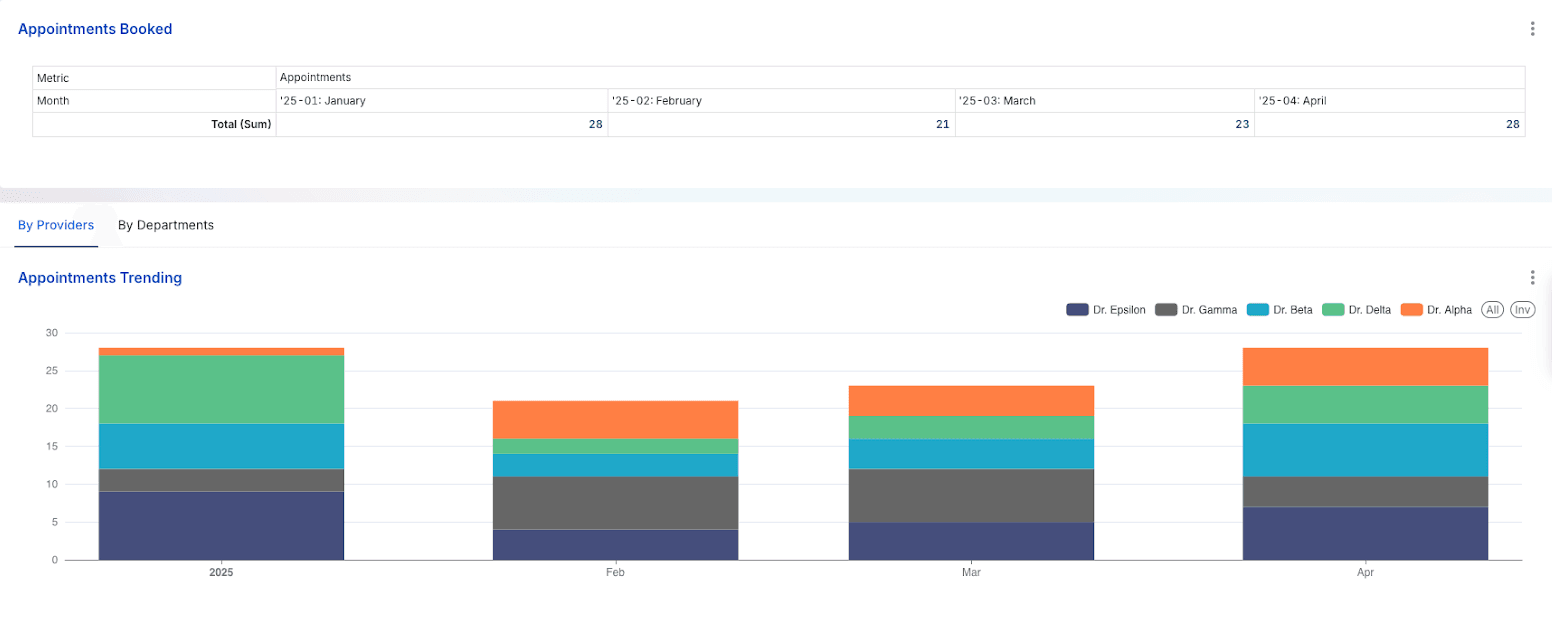
Understanding the nuances of patient access and volume is foundational to effective ambulatory operations. This section delves into metrics that illuminate demand, provider and departmental workloads, and the composition of the patient base.
Analysis of Core Metrics
The mix of these patient types serves as a vital indicator of a practice's health: a high influx of new patients signals growth and successful market outreach, while a robust number of established patients reflects patient loyalty and care continuity. A significant volume of patients "returning after 2 years" (especially if this means they qualify as new patients under the 3-year rule) might indicate successful patient re-engagement initiatives or, conversely, a potential gap in continuous care strategies that allowed such a long lapse. This metric also profoundly impacts scheduling logistics, as new patients generally require more extended appointment slots. Tracking physician panel size, which is influenced by these patient flows, is also crucial for ensuring optimal patient care and managing provider workload effectively.
Table 1: Defining Patient Types and Their Operational/Financial Impact
| Patient Type | CPT Definition Highlights | Typical Appointment Length | Average RVUs (Illustrative E/M) | Key Strategic Focus |
| New Patient | No professional services from a physician in/same specialty & group in the prior 3 years.Requires 3 of 3 key E/M components. | Longer | Higher (e.g., 99203 vs 99213) | Acquisition, Growth |
| Established Patient | Professional services from a physician with/same specialty & group in the prior 3 years.Requires 2 of 3 key E/M components. | Standard | Standard | Retention, Continuity |
| Returning after > 2 Years (Functionally a New Patient) | Same as New Patient if >3 years since last service from physician/same specialty & group. | Longer | Higher (as per New Patient if >3 years), Standard (if > 2 and < 3 years) | Re-engagement, Growth, Retention |
Analytical Insights
A thorough understanding of the patient mix (new versus established) is fundamental for strategic planning. This includes tailoring marketing efforts to attract new patients and implementing robust retention strategies to maintain the loyalty of established patients. Variations in provider-specific patient volumes can point to differences in panel size, patient preferences, or individual provider efficiency. Departmental volume trends can highlight emerging growth areas or specialties facing capacity constraints, thereby guiding future investment decisions.
Case Studies
A primary care network, by closely monitoring patient volume trends, identified a predictable surge in demand during the annual flu season. This foresight allowed them to proactively adjust staffing levels and open additional appointment slots, effectively managing the influx, which in turn reduced patient wait times and enhanced overall patient satisfaction.
In another instance, a clinic analyzed its new versus established patient ratio and discovered that while its marketing initiatives were highly effective in attracting new patients, its retention rates for established patients were below average. This data-driven realization prompted the clinic to launch new programs focused on improving follow-up care protocols and enhancing patient engagement strategies for their existing patient base.
The patient type mix serves as a crucial leading indicator of future revenue stability and growth potential. A consistent stream of new patients is essential for expansion and to counterbalance natural patient attrition. However, a diminishing proportion of returning established patients may signal underlying problems with patient satisfaction, difficulties in accessing follow-up care, or breakdowns in care continuity. While new patients often contribute higher initial RVUs, established patients form a stable, predictable revenue base and incur lower patient acquisition costs. A significant "Returning after > 3 Years" segment, for example, points towards opportunities for revenue recapture and a need to investigate why these patients lapsed from continuous care. Therefore, monitoring the balance and trends among these patient types offers a more profound insight into the long-term financial health and market perception of the clinic than merely looking at total patient volume. A declining trend in new patient acquisition might necessitate a review of marketing strategies, whereas a drop in established patient visits could trigger an in-depth investigation into patient satisfaction levels or accessibility issues.
Similarly, provider-specific patient volume data, when examined thoughtfully, can function as an indirect indicator of potential provider burnout or, conversely, identify areas of untapped capacity. Persistently high patient volumes for particular providers, especially if not mirrored by a proportional generation of RVUs or if leading to consistently extended work hours, can be an early warning sign of impending provider burnout. Provider burnout is a serious concern, as it can precipitate a decline in productivity, an increase in medical errors, and a reduction in patient satisfaction. On the other hand, providers who consistently exhibit low patient volumes may possess untapped capacity. This capacity could be better utilized through optimized scheduling practices, enhanced internal referral processes, or targeted marketing of their specific skills and services. Consequently, this metric, when correlated with others such as RVUs per visit, appointment lead times for that provider, and even qualitative feedback from patients and staff, can help ambulatory care leaders proactively manage provider workloads, implement strategies to prevent burnout, and optimize the productivity of the entire clinical team.
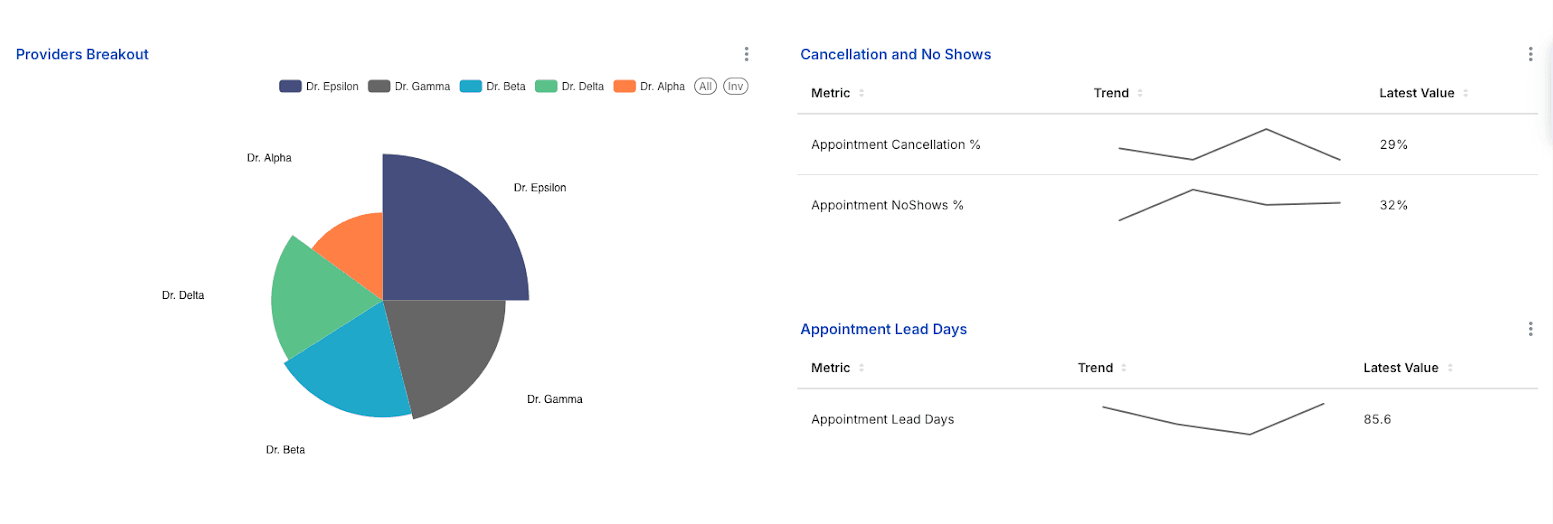
Effective appointment management is the bedrock of an efficient ambulatory practice and a key driver of patient satisfaction. This section examines metrics related to appointment volumes, scheduling effectiveness, and the critical issues of cancellations and no-shows.
Analysis of Core Metrics
Analytical Insights
Elevated no-show and cancellation rates represent a substantial drain on clinic resources and revenue. A critical first step in addressing this is to understand the root causes, which may include excessively long lead times, inadequate appointment reminder systems, patient transportation challenges, or financial concerns. Appointment lead days serve as a crucial metric for patient access. Protracted lead times can act as a deterrent for new patients and a source of frustration for established ones, potentially compelling them to seek care from alternative providers. Analyzing provider-specific no-show/cancellation rates and lead times can also highlight issues related to a particular provider's schedule management, the complexity of their patient panel, or the effectiveness of their patient communication strategies.
Case Studies
1. SAFE-D Dashboard: The implementation of an ambulatory safety dashboard known as SAFE-D, specifically designed to track patients overdue for critical anti-coagulant monitoring and to facilitate the scheduling of their appointments, resulted in a notable 10% decrease in the average monthly no-show rate. This case illustrates how targeted, technology-driven interventions can significantly improve attendance for essential medical appointments.
2. Pediatric Subspecialty Clinic - Lead Time Impact: Research conducted by Drewek et al. in pediatric pulmonology and gastroenterology clinics established a strong correlation between longer appointment lead times and increased no-show rates, a phenomenon particularly pronounced among new patients. This study underscores the strategic importance of prioritizing shorter lead times, especially for new patient appointments, to enhance patient engagement and reduce the number of wasted appointment slots.
3. Scheduling Optimization - Wave Scheduling: A busy urban clinic adopted the "wave scheduling" technique, where several patients were scheduled at the beginning of each hour and then seen on a first-come, first-served basis within that wave. This approach effectively absorbed the impact of patients arriving late and accommodated shorter-than-expected visits. The time saved from these variations was then available for appointments that inevitably ran longer, leading to a reduction in overall patient wait times in the reception area and a smoother, more predictable flow for providers throughout the day.
The metrics of appointment lead days and no-show rates are not independent variables; they are deeply intertwined in a potentially detrimental cycle. Extended lead times inherently increase the likelihood of intervening life events, forgotten appointments, or patients opting for alternative care sources, all of which contribute to higher no-show rates. In turn, a high frequency of no-shows results in unused appointment slots. This can lead to inefficient scheduling practices as staff may attempt to "catch up" by overbooking future schedules or by being hesitant to fill near-term openings, potentially artificially inflating future lead times and perpetuating the problem.
Understanding why patients cancel appointments, beyond just the cancellation rate, can reveal systemic issues like financial barriers, transportation problems, or dissatisfaction. Tracking cancellation reasons transforms the metric into a diagnostic tool, guiding solutions such as expanded telehealth, clearer financial aid info, or adjusted hours. High no-shows and cancellations cause not only lost revenue but also a significant, often uncounted, administrative burden. Staff spend substantial non-billable time on follow-ups, rescheduling, and schedule management, detracting from patient care. This overhead makes the true cost of no-shows much higher than just lost visit revenue, justifying investment in reduction strategies.
Table 2: No-Show/Cancellation Rate Benchmarks and Mitigation Strategies
| Metric | Industry Benchmark | Common Causes | Evidence-based Mitigation Strategies |
| No-show Rate | 5-10% (Good) | Forgetfulness (often a third of the cases) , Long Lead Times, Transportation, Cost, and Illness | Automated Reminders (SMS/Email), Optimize Lead Times, Patient Education on Policies, Telehealth Options, Staff Education |
| Cancellation Rate | Varies; aim to minimize | Scheduling Conflicts, Change in Condition, Cost, Transportation | Easy Rescheduling Process, Appointment Reminders with Cancellation Option, Clear Cancellation Policy, Pre-visit Financial Counseling |
As ambulatory care continues to expand and evolve in response to shifting patient expectations and value-based care mandates, data-driven strategies are no longer optional—they are foundational. By leveraging robust analytics across access, volume, and scheduling metrics, healthcare organizations can uncover critical insights that drive smarter resource allocation, improved patient experiences, and sustainable growth.
Dashboards serve not just as tools for visualization, but as catalysts for cultural transformation—embedding data into the DNA of daily decision-making. When paired with thoughtful change management and provider engagement, these tools empower organizations to anticipate demand, reduce inefficiencies, and deliver care that is not only timely but truly patient-centered.
The future of ambulatory operations lies in the intelligent application of data, and those who master it will lead the way in both performance and care delivery.
Stay tuned for Part 2 of this blog series, where we will explore how ambulatory operations dashboards can be leveraged for financial performance monitoring, staff productivity, and strategic planning.
Join over 3,200 subscribers and keep up-to-date with the latest innovations & best practices in Healthcare IT.
Migrating to a new Electronic Health Record (EHR) system is a critical decision for healthcare organizations …

Since the release of the Cures Act Final Rule in May 2020, the US healthcare industry has been experiencing a …

In the modern world where data is king and more is more, we’re going to take another stance: less is more. Or …