
Consent In Healthcare Interoperability
When presented with a large stack of forms to complete upon arrival at the doctor’s office, most of us plow …

Following our first article - ‘Scrumming the Right Metrics: Driving Proactive Financial Monitoring in Healthcare’, this second installment explores how to operationalize that foundation using a targeted set of advanced metrics.
Now that we’ve examined how to identify financial risks and inefficiencies using utilization trends, it's time to look at specific metric categories—like inpatient admissions, emergency care, and prescription drug spending—that can help healthcare finance leaders drive smarter, value-focused decisions.
In an era where healthcare costs are rising and budgets are tightening, finance leaders in health systems and payers can no longer afford to rely on surface-level reporting. To make smarter decisions, it’s critical to track the metrics that truly impact both cost and care quality. Traditional financial indicators offer only part of the picture—what’s needed is a deeper dive into the clinical and operational metrics that drive long-term sustainability.
This blog explores six advanced metric categories that offer sharper insights into healthcare financial performance—from identifying high-cost members to understanding where dollars are flowing in pharmacy and surgical care. When healthcare finance teams focus on what truly matters, they can better manage risk, align resources, and ultimately improve outcomes for both patients and organizations.
Explore:
1. Claims Utilization & High-cost Members: Identifying Key Cost Drivers
2. Emergency & Urgent Care Metrics: Gauging Unscheduled Acute Care
3. Primary Physician Utilization & Costs: Assessing Engagement and System Foundation
4. Inpatient Admissions & Hospitalization Metrics: Managing High-acuity Care and Efficiency
5. Outpatient Surgery Metrics: Navigating the Shift in Surgical Care Delivery
6. Pharmacy & Prescription Drug Spending: Addressing a Key Cost Driver
While PMPM provides an overall cost view, understanding how those costs are distributed requires analyzing claims utilization patterns and identifying members who account for a disproportionate share of spending.
I. Claims per 1000:
Definition: A standardized measure of the volume of healthcare services utilized by a population, expressed as the number of claims per 1,000 members over a specific period (typically annualized). This can be applied to various types of claims (e.g., inpatient admissions, ER visits, office visits, prescriptions).
Significance: Standardizes utilization volume across populations of different sizes, enabling accurate comparisons of service use rates. It helps identify areas of high or low service use relative to benchmarks or prior periods, informing utilization management and network strategies. It is a core component, along with unit cost, in explaining PMPM trends.
II. High-cost Claimants (HCCs):
Definition: Members whose total healthcare claims exceed a specified monetary threshold within a defined period (usually a year). The threshold is not universally standardized and varies depending on the analysis or program. Common examples include $50,000, $100,000, or the $1 million threshold used for the ACA High-Cost Risk Pool (HCRP) program.
Significance: Pinpoints the small subset of members who drive a large portion of overall healthcare spending. Identifying these members is critical for targeted care management, risk stratification, financial forecasting, and evaluating the need for risk mitigation tools like stop-loss insurance or reinsurance.
III. High-cost Member Expenses / PMPM:
Definition: The total healthcare spending attributable specifically to the identified high-cost claimants, often expressed in total dollars and as a PMPM rate calculated based on the high-cost claimant cohort or the total population.
Significance: Quantifies the financial impact of the highest-cost members on the plan or employer group. Tracking this allows for evaluation of care management effectiveness and the impact of interventions targeting this group.
IV. High-cost Claimants per 1000:
Definition: Standardizes the frequency of high-cost members within a population.
Significance: Allows comparison of the prevalence of high-cost cases across different populations or over time, adjusted for population size. Helps assess underlying population risk and the potential need for risk mitigation strategies.
The concentration of healthcare spending among a small percentage of members is a well-documented phenomenon. Analyses consistently show that a small fraction of members drive a large majority of costs. For example, one study of large employers found that high-cost claimants (defined as >$50,000/year) represented just 1.2% of members but accounted for 31.3% of total health spending. Another estimate suggests the sickest 4% of the population represents 41% of total medical and pharmacy spend, while broader estimates state that 20% of the population accounts for 80% of spending. The average high-cost member in the >$50k study cost $122,382 annually, compared to an average member cost of $4,184 – nearly 30 times higher.
Understanding the nature of these high costs is crucial. High-cost claims arise from both chronic conditions (requiring ongoing, expensive management, like cancer, heart disease, certain autoimmune disorders, or complex specialty drug regimens) and acute events (like severe trauma, complex births, or transplants). The large employer study found a roughly even split, with 52.6% of high-cost claims driven by chronic conditions and 47.4% by acute conditions. This distinction matters for management: chronic high-cost claimants often require long-term, proactive care coordination and disease management, while acute high-cost events may be less predictable but necessitate intensive case management during and after the event to prevent complications and readmissions. Some high-cost claimants exhibit persistency, remaining in high-spending tiers year after year (often due to chronic conditions), while others are high-cost temporarily due to acute events.
Given their financial impact, managing high-cost claimants is a top priority for health plans and employers. Effective strategies often involve intensive care management programs that go beyond simple utilization review. Key components include:
Financial risk mitigation strategies are also essential. Employers, particularly those self-insured, often purchase stop-loss insurance to protect against catastrophic claims exceeding a certain individual or aggregate threshold. The ACA includes the High-Cost Risk Pool (HCRP) program, which functions like stop-loss for individual and small group market plans, reimbursing 60% of costs above $1 million per enrollee. However, analyses show that even with risk adjustment and HCRP recoveries, these programs often do not fully cover the costs of the most extreme claimants, underscoring the need for proactive care management and cost control efforts. Evaluating whether current enrollees have recently incurred very high claims (e.g., >$1M) is a crucial step for issuers in managing HCRP exposure.
The definition of "high-cost" itself influences strategy. A $50,000 threshold captures a broader group potentially amenable to disease management, while a $1 million threshold identifies truly catastrophic cases requiring intensive intervention and financial risk mitigation. The choice of threshold depends on the specific goals of the analysis or program. Regardless of the threshold, the disproportionate impact of this group means that even small improvements in their care trajectory or cost profile can yield significant overall savings. Identifying potential high-cost claimants before they reach catastrophic levels through predictive modeling and risk stratification is increasingly important for proactive intervention.Historical claims data, diagnostic information (like HCCs or RXCs), and demographic factors can feed these models.
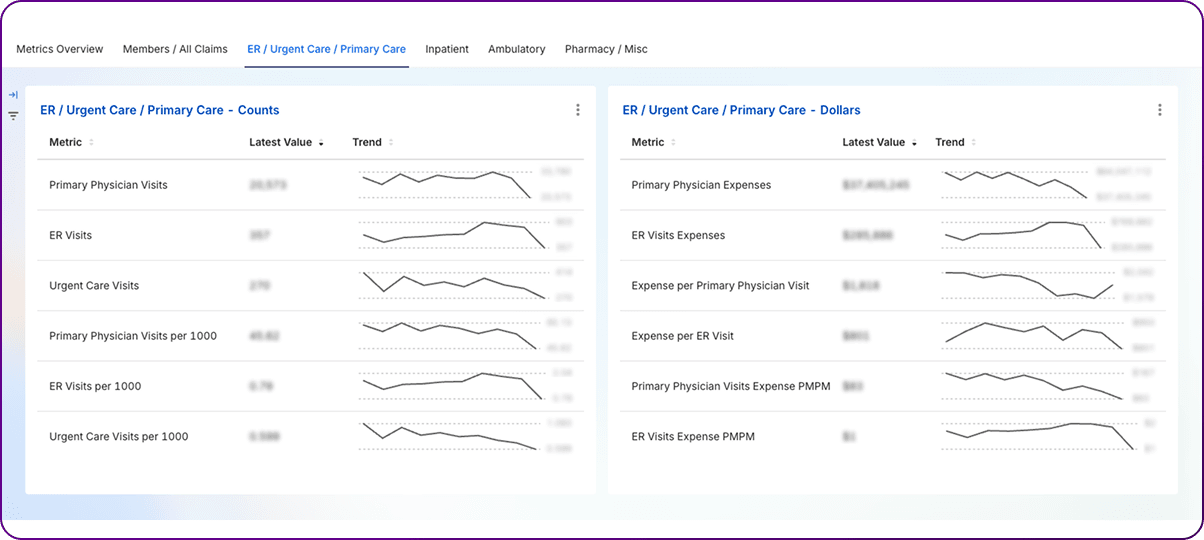
Emergency Department (ER) and Urgent Care (UC) metrics track the utilization and cost of unscheduled acute care services. Trends in these metrics often reflect broader issues related to access, care coordination, and site-of-care decision-making.
I. ER Visits / ER Visits per 1000:
Definition: Tracks the frequency of visits to hospital emergency departments. Per 1000 rate standardizes utilization across populations.
Significance: High ER utilization, particularly for non-emergent conditions or treat-and-release visits, can indicate issues with primary care access, poor chronic disease management, or inappropriate site-of-care choices. It's a major focus for cost containment and efficiency efforts. ER visit rates vary significantly by demographics.
II. ER Visits Expenses & Expense per ER Visit:
Definition: Total costs associated with ER visits and the average cost per visit.
Significance: Provides financial insights into ER spending. ER visits are significantly more expensive than other settings, like urgent care or physician offices, for similar low-acuity conditions. High average costs are driven by facility fees and higher charges for ancillary services.
III. Urgent Care Visits / Urgent Care Visits per 1000:
Definition: Evaluates the utilization of urgent care centers, which provide walk-in care for acute but non-life-threatening conditions. Per 1000 rate standardizes utilization.
Significance: Tracks demand for and access to this alternative care setting. Growth in UC utilization is often seen as a potential way to divert non-emergent ER visits.
IV. Expense per Urgent Care Visit:
Definition: The average cost associated with an urgent care visit.
Significance: Allows assessment of UC cost-efficiency, particularly compared to ER visits. UCs typically have significantly lower average costs than ERs.
There is a well-established inverse relationship between access to robust primary care and the utilization of emergency departments, especially for non-urgent issues or conditions considered Ambulatory Care Sensitive Conditions (ACSCs) – problems potentially preventable or manageable with good outpatient care. Studies show that populations with better primary care access tend to have lower ER visit rates. Conversely, barriers to primary care, such as lack of insurance, inability to get timely appointments, inconvenient clinic hours, transportation issues, or lack of a usual source of care, often lead patients to use the ER as a default option, even for routine care needs. For example, one study found that longer distances to the nearest urgent care center and designation as a primary care shortage area correlated with higher acute care visits (including ER) for ACSCs among Medicaid patients. Another noted that individuals living in lower-income households or with lower education levels made significantly more preventable ER visits, often linked to primary care access issues.
Urgent care centers have proliferated with the explicit goal of providing a more convenient and lower-cost alternative to the ER for non-emergent conditions. They offer walk-in access and extended hours, addressing some of the access barriers associated with traditional primary care. Evidence suggests that the presence of urgent care centers does indeed reduce ER visits, particularly for lower-acuity conditions and among Medicaid/uninsured populations. One study found that an open UC in a ZIP code reduced total ER visits by residents by 17.2%.
However, the assumption that this diversion automatically leads to net cost savings for the healthcare system is challenged by recent research. While the cost per visit is substantially lower at a UC (e.g., average $193) compared to an ER (e.g., average $2,032 for similar conditions), the convenience of UCs may also induce new utilization – people seeking care who might otherwise have stayed home or waited for a PCP appointment. A key study published in Health Affairs estimated a high "substitution ratio": 37 additional UC visits were associated with the reduction of just one lower-acuity ER visit. Because of this high ratio, despite the tenfold price difference per visit, each $1,646 lower-acuity ER visit prevented was offset by $6,327 in increased UC costs, resulting in a net increase in overall spending on lower-acuity care across both settings. Another study focusing on Medicare beneficiaries found that UCC entry was associated with an increase in total Medicare spending ($268 per capita annually after six years) and increased hospital stays, suggesting UCCs might even steer some patients towards higher-cost settings. This highlights that simply adding lower-cost access points doesn't guarantee system savings if it primarily drives new demand rather than efficient substitution.
This complex dynamic underscores that high rates of ER utilization are often a symptom of broader system issues, particularly inadequate access to timely and effective primary care. Disparities in ER use among different demographic groups (higher rates among females, the elderly, low-income communities, rural residents, Medicaid recipients, and the uninsured) further point to underlying inequities in access and health status. Therefore, strategies to optimize site-of-care and reduce "inappropriate" ER use must address these root causes.
Interventions aimed at optimizing site-of-care decisions often focus on strengthening primary care engagement and providing alternatives or guidance. Examples include:
It is also worth noting the distinction between average and marginal costs in the ER setting. While the average cost per ER visit is high due to significant fixed overhead (staffing, equipment), the marginal cost of treating one additional, non-urgent patient may be substantially lower. An older study estimated the marginal cost of a non-urgent ER visit at $24, compared to an average cost of $62 at that time. This suggests that while reducing unnecessary ER visits is crucial for alleviating overcrowding, improving access for true emergencies, and enhancing overall system efficiency, the direct financial savings per diverted non-urgent visit might be less than the average cost figures imply. The primary value proposition may lie more in capacity management and appropriate resource allocation than in dramatic direct cost reduction for each low-acuity case shifted elsewhere.
Primary care serves as the bedrock of an effective healthcare system, focusing on prevention, routine care, chronic disease management, and coordination. Metrics related to primary care utilization and costs gauge patient engagement with this foundational level and its overall efficiency.
I. Primary Physician (PCP) Visits / Per 1000:
Definition: Measures the frequency of patient encounters with primary care providers, typically including physicians specializing in general practice, family medicine, internal medicine, and pediatrics. The per 1000 rate standardizes this frequency across populations.
Significance: This metric indicates the level of patient engagement with the primary care system. Higher rates generally suggest better access and utilization of preventive and routine care services, which can correlate with improved management of chronic conditions and potentially lower rates of costly downstream events like hospitalizations or ER visits. Conversely, low rates might signal barriers to access or underutilization of essential primary care services.
II. Primary Physician Expenses:
Definition: Represents the total costs incurred for services provided by primary care physicians.
Significance: Tracks the overall financial investment in primary care. While primary care constitutes a relatively small percentage of total healthcare spending compared to hospital or specialty care, its influence on overall costs through prevention and coordination is substantial.
III. Expense per Primary Physician Visit:
Definition: Calculates the average cost associated with each primary care visit.
Significance: Helps evaluate the cost efficiency of primary care delivery across different provider networks or over time. Variations can be influenced by the complexity of visits, the mix of services provided during visits (e.g., procedures, tests), and negotiated payment rates.
Robust engagement with primary care is consistently linked to better health outcomes and a more efficient healthcare system. Primary care providers deliver essential preventive services, manage chronic conditions effectively, and serve as the main point of coordination for many patients navigating the complexities of the healthcare system.35 Studies demonstrate tangible benefits: higher frequency of primary care visits (visit cadence) was associated with significantly lower rates of hospital admissions among high-risk Medicare Advantage patients with conditions like congestive heart failure (CHF) and chronic obstructive pulmonary disease (COPD). Furthermore, continuity of care – seeing the same primary care physician consistently – has been linked to lower rates of emergent hospital admissions.
Several factors influence primary care utilization rates. Access remains paramount, encompassing the availability of PCPs (often measured as a physician-to-population ratio), appointment wait times, geographic proximity, clinic operating hours, insurance coverage adequacy, and patient socioeconomic status. Shortages of primary care physicians and long travel distances can significantly impede access, particularly in certain areas. Patient panel size – the number of patients assigned to a single PCP – also plays a role. While ideal estimates vary widely (from 1,000 to over 2,500 patients per physician), excessively large panels can strain provider capacity, reduce the time spent per patient, potentially compromise care quality, and contribute to physician burnout. Smaller panels tend to be associated with higher patient satisfaction and better continuity of care. Panel size itself is influenced by patient factors like age and number of chronic conditions, as well as practice characteristics like setting (community vs. hospital-based) and staffing structure. Patient characteristics such as age, overall health status, number of chronic conditions, health literacy, and trust in their provider also shape how often individuals seek primary care.
The effectiveness of primary care directly impacts downstream utilization. Strong primary care engagement helps prevent unnecessary ER visits and avoidable hospitalizations, particularly those related to ACSCs. PCPs act as crucial coordinators and gatekeepers, guiding patients to appropriate specialty care when needed.
This central role makes primary care a cornerstone of most value-based care (VBC) models, such as Accountable Care Organizations (ACOs) and Patient-Centered Medical Homes (PCMHs). These models shift incentives away from volume (fee-for-service) towards value, often holding PCPs accountable for managing the health of a defined population, improving quality metrics, enhancing care coordination, and ultimately reducing the total cost of care. Success in VBC frequently hinges on metrics reflecting strong primary care performance: high patient engagement rates, timely preventive screenings, effective chronic disease management, and reductions in avoidable ER visits and hospitalizations.
The interconnectedness of the healthcare system means that primary care utilization metrics serve as more than just a count of office visits; they act as a barometer for the overall health and efficiency of the entire system. Low utilization or poor access at the primary care level often leads to a cascade of negative consequences, including delayed diagnoses, worsening chronic conditions, and increased reliance on more expensive acute care settings like ERs and hospitals. Conversely, investments aimed at strengthening primary care access, capacity, and effectiveness can yield leveraged returns across the continuum by preventing costly complications and optimizing resource use. This makes primary care a critical fulcrum for achieving the goals of value-based care – improving population health while controlling total costs.
The ongoing discussion about optimal physician panel size may benefit from reframing the issue around the capacity of the entire primary care team rather than focusing solely on the physician. Practices that effectively utilize the full scope of their team, including nurse practitioners, physician assistants, medical assistants, pharmacists, and health educators, and leverage technology can potentially manage larger patient populations more effectively without sacrificing access or quality. Estimates suggest a significant portion of physician time is spent on tasks that could potentially be delegated to other qualified team members under appropriate supervision. Therefore, measuring primary care capacity might more accurately involve assessing team composition, roles, workflows, and technological support, rather than relying solely on the physician-to-patient ratio.
Finally, while tracking the volume of PCP visits (Visits per 1000) is important, it doesn't capture the intrinsic value or effectiveness of those encounters. A high visit rate doesn't guarantee positive outcomes if the visits are too brief, lack continuity, fail to address underlying patient needs, or aren't well-coordinated. To gain a holistic understanding of primary care performance, utilization metrics must be integrated with measures of quality (such as HEDIS or CMS Quality Rating System (QRS) measures), patient experience (like CAHPS survey results), and downstream outcomes (e.g., rates of preventable hospitalizations or ER visits). This multi-dimensional view aligns better with the principles of value-based care, which prioritizes outcomes and quality over mere volume.
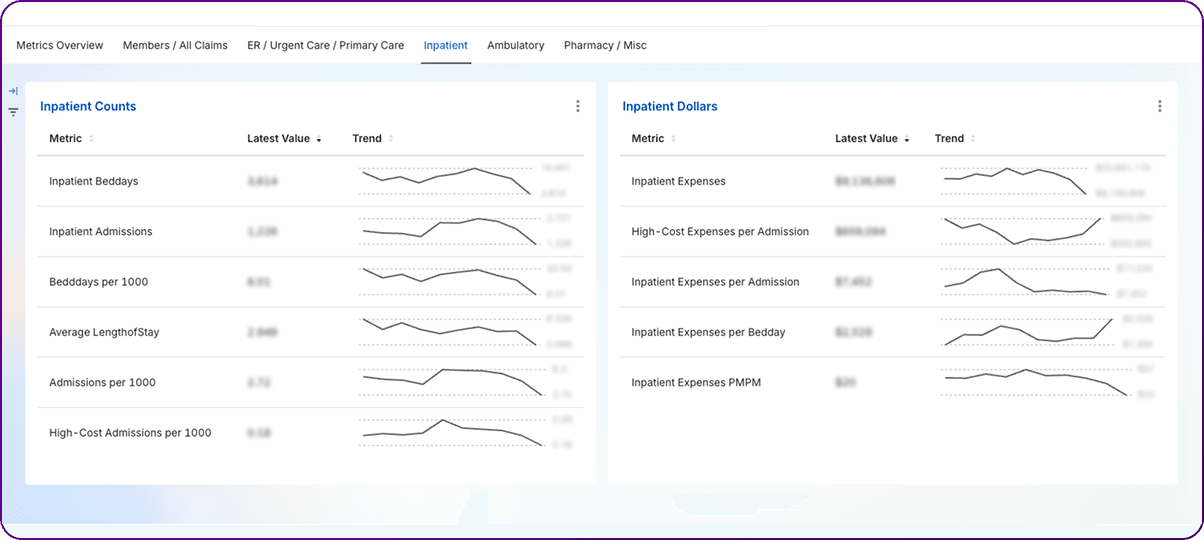
Inpatient care represents a significant portion of healthcare spending, typically involving the most acute and complex medical conditions. Metrics related to inpatient admissions and hospital stays are critical for understanding demand for high-acuity care, managing hospital resources, evaluating efficiency, and identifying opportunities for improvement.
I. Inpatient Admissions / Admissions per 1000:
Definition: Measures the frequency of patients being formally admitted to a hospital for inpatient care. The per 1000 rate standardizes this measure across different population sizes.
Significance: This is a key indicator of the demand for acute hospital services within a population. It reflects population morbidity, the effectiveness of preventive care and chronic disease management in the outpatient setting, and potential access issues. High admission rates, especially for conditions deemed preventable or manageable outside the hospital (tracked by metrics like AHRQ's Prevention Quality Indicators or PQIs), can signal upstream problems in care delivery.
II. Inpatient Beddays / Per 1000:
Definition: Represents the total number of days that patients collectively spent in inpatient hospital beds during a specific period. Also commonly referred to as "patient days." The per 1000 rate standardizes this measure of total bed usage.
Significance: Measures the total volume of inpatient resource consumption. This metric is crucial for hospital capacity planning, staffing level determination, and overall resource allocation. It is directly influenced by both the rate of admissions and the average length of stay per admission.
III. Average Length of Stay (ALOS):
Definition: The average number of days a patient remains in the hospital during a single inpatient admission.
Significance: ALOS is a widely used indicator of hospital efficiency, resource utilization, and the effectiveness of care processes. A longer ALOS can suggest operational inefficiencies (e.g., delays in tests or consults), patient complications, barriers to discharge (e.g., lack of post-acute care availability), or higher patient acuity. Conversely, a shorter ALOS might indicate efficient care but requires monitoring to ensure patients are not being discharged prematurely, potentially leading to readmissions. Managing ALOS is critical for cost control, particularly under payment systems like Diagnosis-Related Groups (DRGs) or bundled payments, where reimbursement is fixed per admission.
IV. Inpatient Expenses Per Admission / Per Bedday:
Definition: Measures the average cost associated with each hospital admission or each day spent in the hospital.
Calculation: Expense per Admission = Total Inpatient Expenses / Total Admissions.1 Expense per Bedday = Total Inpatient Expenses / Total Beddays.
Significance: These metrics help break down hospitalization costs to understand key drivers and identify opportunities for cost optimization. Expense per admission reflects the overall cost of treating an inpatient episode, while expense per bedday indicates the intensity of resource use on a daily basis. They are useful for evaluating the financial impact of efficiency improvements or changes in care protocols.
Admission rates are influenced by a multitude of factors including population demographics (particularly age and the prevalence of chronic conditions), socioeconomic status, access to and quality of primary and preventive care (with poor access correlating with higher rates, especially for ACSCs), local physician practice patterns, and the financial incentives embedded in hospital and health system structures.
Average Length of Stay (ALOS) is similarly affected by a complex interplay of variables. Patient-related factors like clinical severity, the number and type of comorbidities (reflected in measures like the Case Mix Index or CMI), and age are significant drivers; sicker, more complex patients naturally require longer stays. However, substantial variation in ALOS often stems from hospital-level factors related to efficiency and care coordination. Streamlined processes for admission, diagnostic testing, consultations, and discharge planning can significantly shorten stays. Effective communication and collaboration among multidisciplinary teams (physicians, nurses, case managers, therapists, social workers) are crucial for smooth patient progression and timely discharge; structured interprofessional rounds have been shown to improve coordination and reduce LOS. Conversely, delays in obtaining tests or consultations, poor handoffs between providers, or inadequate discharge planning contribute to longer stays. The occurrence of hospital-acquired conditions (HACs) or other patient safety events (tracked by metrics like AHRQ's Patient Safety Indicators or PSIs ) invariably extends ALOS and increases costs.
External factors, particularly the availability and capacity of post-acute care (PAC) services (skilled nursing facilities (SNFs), rehabilitation centers, home health agencies), play a critical role. Bottlenecks in discharging patients to appropriate PAC settings due to bed shortages, staffing issues at PAC facilities, or delays in insurance authorizations can lead to patients occupying acute care beds longer than medically necessary, significantly inflating ALOS. This challenge was notably exacerbated during and after the COVID-19 pandemic.
Because ALOS is influenced by so many factors, it serves as a sensitive barometer reflecting not just time spent in a bed, but the overall interplay of clinical severity, internal hospital operations, care coordination effectiveness, and external system constraints like PAC capacity. A rising ALOS often signals multiple underlying issues requiring investigation. Hospitals employ various strategies to manage inpatient utilization and improve efficiency:
Inefficiencies in the inpatient setting have broader consequences. Delays in discharging patients create bottlenecks that back up into the emergency department, leading to ER boarding, where admitted patients wait for hours or days in the ER for an inpatient bed. This reduces the hospital's capacity to accept new admissions, potentially forcing the postponement of elective surgeries and impacting overall hospital throughput and financial health. Therefore, optimizing inpatient flow and reducing unnecessary days is critical not only for managing inpatient costs but also for maintaining the operational health of the entire acute care system.
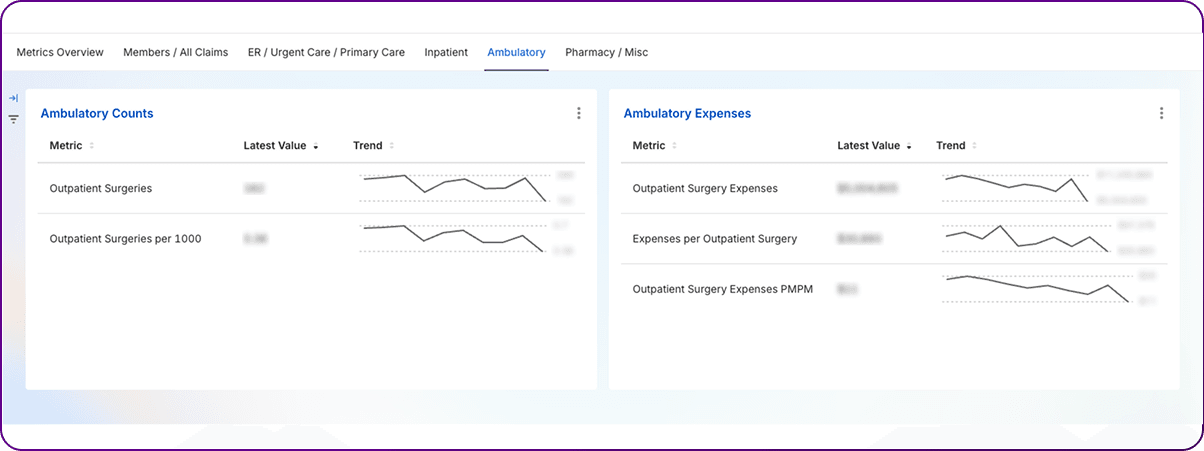
The delivery of surgical care has undergone a significant transformation, with a pronounced shift from traditional inpatient hospital stays to outpatient settings, including Hospital Outpatient Departments (HOPDs) and Ambulatory Surgery Centers (ASCs). Metrics in this category track this trend and evaluate the cost-efficiency of procedures performed outside the inpatient environment.
I. Outpatient Surgeries / Per 1000:
Definition: Measures the rate at which surgical procedures are performed in settings that do not require an overnight hospital stay. This includes procedures done in HOPDs and freestanding ASCs. The per 1000 rate standardizes this measure for population comparisons.
Significance: Tracks the magnitude and growth of surgical care migrating to outpatient settings. This trend is driven by technological advances allowing less invasive procedures, payer initiatives promoting lower-cost settings, patient preference for convenience, and evolving regulatory policies (e.g., CMS expanding the list of ASC-covered procedures). Monitoring this metric helps assess demand, capacity planning for outpatient facilities, and the impact of site-of-care strategies.
II. Expenses per Outpatient Surgery:
Definition: Represents the average cost associated with a surgical procedure performed in an outpatient setting. Costs typically include both a facility fee (for the HOPD or ASC) and a professional fee (for the surgeon and potentially an anesthesiologist).
Significance: Provides crucial insights into the cost-efficiency of performing surgeries in different outpatient environments. It allows for direct cost comparisons between HOPDs and ASCs, and also relative to inpatient costs for similar procedures. This metric is fundamental for developing strategies aimed at optimizing the site of surgical care to achieve cost savings while maintaining quality.
The shift towards outpatient surgery is undeniable and accelerating. Data indicates a clear migration of surgical volume away from inpatient settings. For commercially insured populations between 2019 and 2021, inpatient surgery utilization (claims per 1,000 members) decreased by 7.3%, while HOPD surgery volume increased by 3.1% and ASC utilization surged by 10.3%. Similarly, Medicare Fee-for-Service (FFS) data shows the volume of ASC surgical procedures per beneficiary grew by 2.8% in 2022. This trend is supported by growth in the number of ASCs and their operating room capacity.
A primary driver of this shift is the cost-effectiveness of outpatient settings, particularly ASCs, compared to inpatient care. ASCs generally operate with lower overhead costs and consequently charge lower facility fees than HOPDs or inpatient facilities. Numerous studies and analyses demonstrate significant cost savings:
However, costs for outpatient surgery are not static and have been rising. A study examining common outpatient procedures from 2011 to 2017 found that overall total payments increased by 29%, while patient out-of-pocket (OOP) expenses grew even faster at 50%. This increase was overwhelmingly driven by a 53% rise in facility fees, while professional fees remained essentially flat. This points to the facility component as the primary factor influencing both the cost difference between settings (office vs. ASC vs. HOPD) and the overall inflation in outpatient surgery costs. Procedures performed in ASCs and HOPDs were found to cost significantly more ($2,019 and $2,649 more in predicted total payments, respectively) than the same procedures performed in an office setting, largely attributable to the addition of a facility fee.
This dynamic has significant market implications. Hospitals face considerable revenue pressure as historically profitable surgical cases migrate to lower-cost outpatient settings, particularly ASCs, which may be independently owned or joint ventures. This incentivizes hospitals to develop their robust outpatient strategies, acquire or partner with ASCs, or risk losing market share. Payers, on the other hand, see a major opportunity for cost savings by actively steering appropriate cases towards ASCs through network design, benefit incentives, and utilization management policies. This site-of-care optimization aligns well with value-based care principles focused on delivering appropriate care in the most cost-effective setting. New payment models, such as bundled payments for specific outpatient surgical episodes, are also emerging to further incentivize efficiency and coordination.
While the shift to outpatient surgery offers cost advantages, it also introduces new considerations. Ensuring consistent quality of care and patient safety across a more fragmented landscape of HOPDs and numerous ASCs requires robust oversight and quality measurement. Maintaining effective communication and care coordination between the surgical setting and the patient's primary care physician is also essential to avoid fragmentation, especially for patients with comorbidities. Furthermore, the rapid growth of ASCs brings operational challenges, including staffing shortages for specialized nurses and technicians, which could impact capacity and potentially costs in the future.
Finally, the trend of patient out-of-pocket costs rising faster than total payments in the outpatient surgery arena warrants attention. As more procedures shift to outpatient settings, patients may face increasing financial exposure through deductibles and coinsurance applied to these services, particularly the substantial facility fees. This cost-shifting could potentially create affordability barriers for patients, even for procedures performed in settings intended to be more economical. Benefit design needs to consider this impact to ensure access is not unduly restricted by patient cost-sharing burdens.
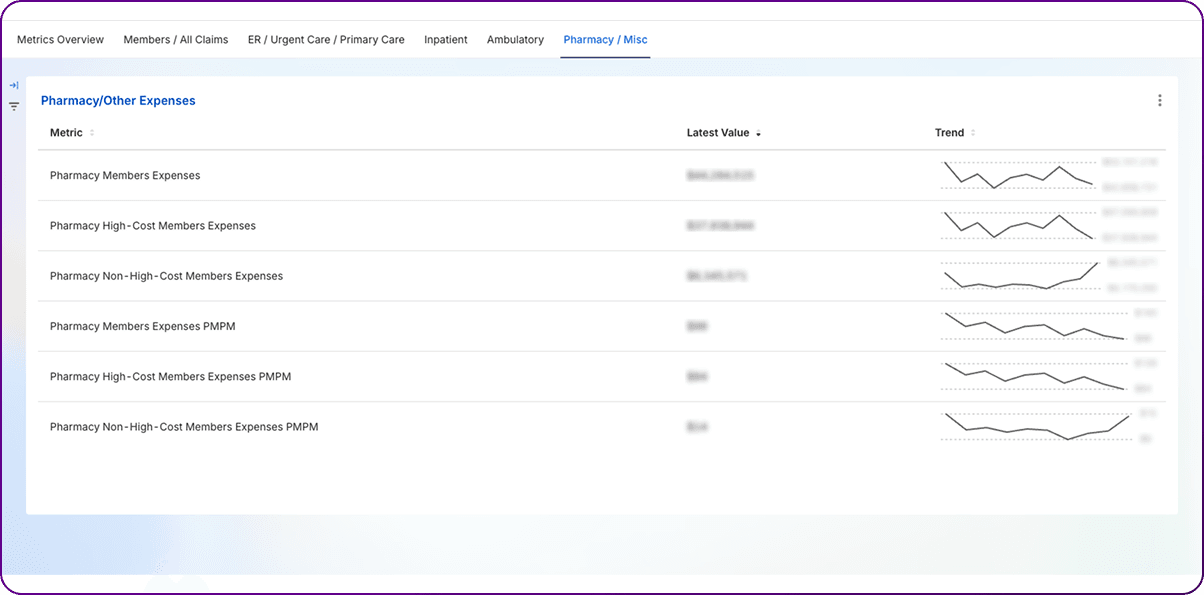
Spending on prescription drugs represents a significant and rapidly growing component of overall healthcare costs, making pharmacy-related metrics a critical focus for health plans, employers, and PBMs.
I. Pharmacy Members Expenses / PMPM:
Definition: This metric quantifies the average cost of prescription drugs per plan member on a monthly basis.
Significance: Isolates the pharmaceutical component of healthcare spending, allowing stakeholders to track drug cost trends, benchmark performance, evaluate the effectiveness of PBM contracts and formulary strategies, and forecast future drug expenditures. Given that drug spending is a major driver of overall healthcare cost increases, this metric is under intense scrutiny.
II. High-cost vs. Non-high-cost Pharmacy Member Expenses:
Definition: This involves segregating the total pharmacy spending into two categories: spending attributable to members who exceed a defined high-cost threshold (often driven by expensive specialty medications) and spending for the remaining members.
Significance: This breakdown illuminates the distribution of pharmacy costs within a population. It highlights the disproportionate financial impact of a relatively small number of members using very expensive medications, primarily specialty drugs. This understanding is crucial for developing targeted management strategies, differentiating approaches for managing common chronic medications versus high-cost specialty therapies, and assessing risk related to catastrophic drug costs.
Pharmacy PMPM is driven by a combination of factors: the volume of prescriptions utilized, the unit cost of those prescriptions, and the mix of drugs being used. Both utilization and unit costs have been increasing, contributing to overall PMPM growth. A significant factor influencing both unit cost and mix is the rise of specialty drugs – high-cost medications, often biologics, used to treat complex conditions like cancer, multiple sclerosis, and rheumatoid arthritis. These drugs, while offering significant therapeutic benefits, come with extremely high price tags and are responsible for the vast majority of recent net drug spending growth – one source attributes nearly 93% of net drug spend growth since 2014 to biologics. In California, prescription drugs accounted for 13.3% of total health plan premiums in 2021, up from 12.7% in 2020. National data showed an 11.4% increase in prescription drug spending in 2023.
The impact of specialty drugs is concentrated among a small number of high-cost pharmacy members. These individuals can incur costs exceeding $1 million annually from pharmacy claims alone, potentially triggering programs like the ACA HCRP. While generic drugs account for the vast majority of prescriptions filled (e.g., 88.2% in California in 2021), they represent a much smaller fraction of the total cost (16.3% in CA 2021). Conversely, specialty drugs, representing a tiny fraction of prescription volume (e.g., 1.6% in CA 2021), accounted for the largest share of spending (62.9% in CA 2021). This stark disparity underscores why effectively managing overall pharmacy PMPM necessitates sophisticated and targeted strategies specifically aimed at specialty pharmaceuticals.
Health plans and employers utilize various levers, often managed by PBMs, to control pharmacy PMPM:
While maximizing generic utilization remains important, the already high generic dispensing rates (GDR) in many markets (approaching 90%) suggest diminishing returns for achieving significant future PMPM savings solely through further increases in GDR. While maintaining high GDR is essential, the focus for substantial future cost control must increasingly shift towards managing the cost and utilization of the remaining brand drugs and, critically, the rapidly growing specialty drug category. This includes negotiating better net prices, promoting biosimilars, ensuring appropriate utilization, and potentially addressing high launch prices or significant price increases for existing generics.
In today’s healthcare financial landscape, data alone is not enough—it must be structured, visualized, and acted upon to drive meaningful outcomes. The metrics discussed throughout this article provide deep insights into cost efficiency, utilization trends, and financial sustainability, but their true value emerges when they are integrated into a disciplined, recurring review process.
This is where the dashboard and metrics scrumming approach becomes indispensable. By tracking which metrics advance or decline each month, healthcare leaders can pinpoint inefficiencies, diagnose root causes, and implement corrective actions in real time. The split-screen visualization of advancing vs. declining metrics ensures that decision-makers can quickly assess financial health and prioritize interventions, fostering agility, transparency, and accountability across teams.
Organizations that embrace structured metric reviews and dashboard-driven insights gain a competitive edge, ensuring financial stability, optimized resource allocation, and improved patient care affordability. In an era where margins are tightening and data volumes are expanding, those who treat metrics as a living, breathing component of their management system will drive sustainable success.
If you want to build this dashboard or need consulting help with ideas/content discussed in this article, get in touch with us—we’d love to help you turn data into action!
Smarter healthcare finance starts with measuring what matters most. By focusing on advanced metrics like claims utilization, urgent care trends, and prescription drug spending, financial leaders can move beyond reactive cost-cutting and towards a proactive, value-driven strategy. These insights empower organizations to pinpoint inefficiencies, optimize resource allocation, and drive better care at a lower cost. As the industry continues to evolve, the finance teams that embrace a more data-informed, clinically aligned approach will be the ones leading the charge toward a more sustainable healthcare future.
Interested in exploring a real-time financial metrics dashboard? Schedule a quick demo with our experts to see how it can work for your organization.
Join over 3,200 subscribers and keep up-to-date with the latest innovations & best practices in Healthcare IT.
When presented with a large stack of forms to complete upon arrival at the doctor’s office, most of us plow …

Has the idea of switching archival vendors ever crossed your mind as a healthcare provider? For most medical …

According to Gartner, 83% of data migration projects either fail or exceed their budgets and schedules. This …