
Securing Legacy Patient Health Data With Muspell Archive
Securing legacy health data integrity using an archival solution isn't just a recommendation anymore; it's …

Here is a good idea. Analytics for Healthcare financial management to be built on the foundation of claims data—a vast, intricate network of metrics that dictate cost efficiency, resource allocation, and care outcomes.
By meticulously analyzing utilization trends such as - Members Expenses Per Member Per Month (PMPM), Claims per 1,000, Expense per Urgent Care Visit, and High-Cost Claimant Ratios, organizations can break down the complexities of financial sustainability.
However, true financial mastery requires more than tracking raw numbers—it demands comparative analysis to benchmark against industry standards, strategic decision-making that transforms data into action, and actionable insights that optimize costs while enhancing patient outcomes.
This first article in our two-part series explores how harnessing key claims-based metrics can help organizations shift from reactive to proactive financial management. By analyzing utilization trends like PMPM costs, urgent care usage, and high-cost member ratios, healthcare leaders can begin identifying inefficiencies and uncovering financial risks before they escalate.
In Part 2, we’ll take this foundation further, examining six specific advanced metric categories—ranging from inpatient care to pharmacy spending—that offer deeper insights into smarter financial strategy.
Pinpointing outliers, spotting inefficiencies, and predicting financial risks are no longer optional—they are essential practices for organizations aiming to stay ahead of healthcare’s fiscal curve. A deeper dive into claims data allows healthcare executives to categorize costs into high-cost versus non-high-cost segments, uncovering disproportionate spending patterns and utilization surges that may be draining resources. By examining metrics such as High-Cost Members Expense PMPM and Claims per 1,000, leaders gain granular visibility into how a small subset of members might be exerting outsized financial pressure. Similarly, comparing Primary Physician Visits Expense PMPM with Urgent Care Visits PMPM can highlight inefficiencies in care access and delivery. For instance, an upward trend in urgent care usage compared to primary care visits may signal a breakdown in preventive care engagement, prompting a need for strategic adjustments in patient outreach programs, care coordination efforts, or even provider contracting models.
What we cover:
The healthcare landscape is characterized by complex interactions between cost, utilization, and quality. Understanding the metrics used to track these elements is crucial for stakeholders across the system, including health plans, employers, providers, and policymakers.
Let's delve into key healthcare metric categories, defining specific measures, explaining their calculation, detailing their significance, and exploring the analytical insights derived from them.
By examining trends in enrollment, expenses, utilization patterns across different care settings (emergency, primary care, inpatient, outpatient), high-cost populations, pharmacy spending, and long-term care, this analysis aims to provide deeper knowledge regarding cost drivers, efficiency levers, and population health management strategies within the U.S. healthcare system.
Understanding the covered population and the total costs incurred is fundamental to any healthcare analysis. Member enrollment and expense metrics provide the baseline for assessing performance, managing budgets, and identifying cost drivers.
1. Members Enrolled:
Definition: This metric tracks the total number of unique individuals covered by a health plan or healthcare organization during a specific period.
Significance: Serves as the foundational denominator for calculating per-member costs and utilization rates, allowing for standardized comparisons across different populations or time periods. It defines the population base for risk assessment and resource allocation.
2. Members Expenses:
Definition: Represents the total healthcare costs incurred by or paid on behalf of all enrolled members within a specified period. This typically includes payments for medical services (inpatient, outpatient, professional) and pharmacy claims.
Significance: Reflects the overall financial burden of healthcare for the covered population. Tracking total expenses is essential for financial reporting, profitability analysis, and understanding the magnitude of healthcare spending.
3. Members' Expenses Per Member Per Month (PMPM):
Definition: This crucial metric measures the average healthcare expense incurred for each enrolled member, normalized on a monthly basis.
Significance: PMPM is a vital financial indicator used extensively by health plans, employers, and providers. It provides a standardized way to compare costs across different populations, track cost trends over time, evaluate the efficiency of healthcare programs, and forecast future expenses for budgeting and financial planning. It serves as a key performance indicator for cost management efforts.
Health plans and managed care organizations rely heavily on PMPM metrics for rate setting, resource allocation, and assessing financial performance against targets. For instance, Coordinated Care Organizations (CCOs) like Health Share of Oregon use PMPM analysis to forecast utilization for rate-setting negotiations with state authorities (like the Oregon Health Authority) and manage financial risk under capitation models. Accurate PMPM forecasting is critical to ensure financial solvency, especially when risk-sharing arrangements involve potential liabilities if actual costs exceed projected PMPM rates. Developing financial projections for new health plans involves building actuarial cost models to determine expected incurred claims PMPM by year, which forms the basis for projecting revenue needs and solvency.
Self-insured employers use PMPM data to understand their healthcare spending per employee, budget for future costs, evaluate the effectiveness of their benefit design and wellness programs, and assess the performance of their Pharmacy Benefit Managers (PBMs). Tracking PMPM trends helps employers identify cost spikes and make informed decisions about cost-saving measures, such as promoting generic drug use or adjusting plan designs during open enrollment. Case studies illustrate the impact of strategic interventions on PMPM. For example, Hamilton Health Box reported that implementing onsite healthcare clinics helped client organizations achieve a $132 decrease in PMPM total spend, partly by reducing ER and urgent care visits. Another case involved the Montana State Health Plan, which used claims data analysis to identify high hospital costs and implemented reference-based pricing, resulting in significant PMPM savings ($60 inpatient, $32 outpatient PMPM) and reversing projected insolvency. Budget impact models (BIMs) developed for medical device companies often use PMPM calculations to demonstrate potential cost savings or offsets to health plans, aiding in coverage decisions.
While PMPM provides a standardized cost measure, its interpretation requires context. PMPM inherently averages costs across a diverse population. Comparing PMPM figures between different groups without accounting for differences in demographics, health status (morbidity), benefit design, provider network contracts, and geography can be misleading. Risk adjustment methodologies, such as those using Hierarchical Condition Categories (HCCs), are often applied to PMPM costs to normalize for population health differences, creating a more level playing field for comparison. A normalized risk score adjusts the cost to reflect whether a population is sicker (score > 1.0) or healthier (score < 1.0) than average. Furthermore, PMPM is fundamentally a lagging indicator reflecting past spending. To be actionable for cost management, it must be decomposed into its underlying drivers: utilization (how often services are used) and unit cost (the price per service). Analyzing trends in utilization (e.g., visits per 1000) and unit cost (e.g., cost per visit) provides insight into why PMPM is changing and where interventions might be most effective.
While healthcare financial metrics provide invaluable insights, their true power will be lost if they are not visualized, interpreted, and acted upon. A well-designed dashboard transforms raw data into a dynamic decision-making tool, enabling stakeholders to track trends, diagnose inefficiencies, and implement corrective actions in real time.
Adopting a metrics scrum approach, inspired by agile methodologies, ensures that financial leaders, operations teams, and clinical executives engage in recurring, structured reviews of Key Performance Indicators (KPIs). By continuously monitoring claims utilization, cost trends, and patient engagement metrics, organizations can swiftly identify rising A/R days, spikes in denials, or inefficiencies in care delivery—allowing for proactive interventions rather than reactive adjustments.
Industry research underscores the importance of frequent metric discussions over traditional quarterly or annual reviews. Organizations that integrate real-time dashboards into their financial strategy achieve faster corrective action, improved alignment, and more stable financial outcomes. By leveraging data-driven insights, healthcare leaders can enhance transparency, foster accountability, and drive measurable productivity gains—ultimately ensuring financial sustainability and optimized patient care delivery.
As the healthcare landscape is fast evolving, financial and utilization metrics require consistent, structured reviews to unlock their full potential. By adopting a monthly metrics scrum, organizations can transform their data into actionable strategies rather than retrospective reports. In these recurring sessions, financial, operational, and clinical leaders assess which Key Performance Indicators (KPIs) are improving or declining, pinpoint root causes of trends, such as unexpected spikes in ER visits or fluctuations in high-cost claimant expenses, and set priorities for intervention.
A disciplined metrics review cadence ensures that insights from claims per 1,000, PMPM expenses, inpatient admission rates, and outpatient surgery costs inform real-time decision-making. When healthcare teams move beyond traditional quarterly or annual performance check-ins and embrace agile, data-driven discussions, they gain immediate visibility into critical financial trends, enabling faster corrective actions and stronger cross-functional alignment. Research highlights that organizations with frequent metric scrums outperform their peers, securing greater operational efficiency, improved patient care affordability, and sustained financial stability.
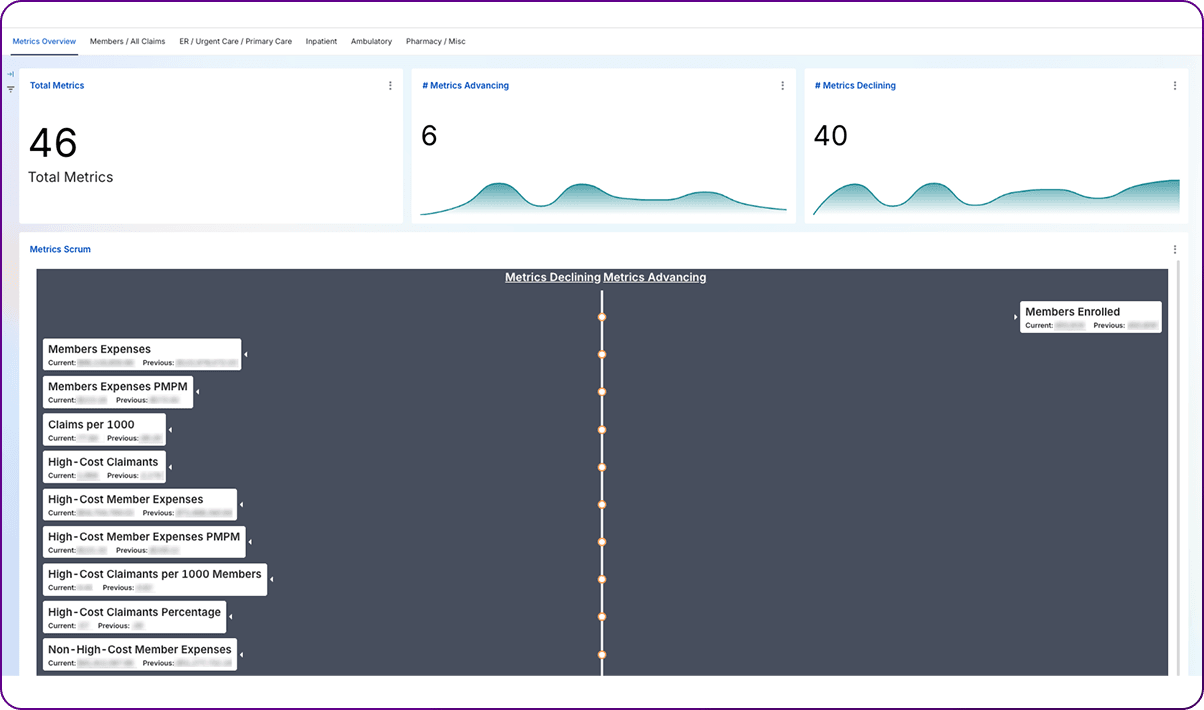
It's a well-known maxim that raw data is only as valuable as the insights it generates. We need a comprehensive dashboard that transforms complex claims metrics into a clear, actionable visualization—allowing decision-makers to track trends, diagnose inefficiencies, and strategize with confidence. We are presenting one such dashboard designed and developed at 314e.
At the heart of this dashboard is the Overview Tab, providing an instant snapshot of total metrics, a breakdown of metrics that have advanced this month, and those that have declined—ensuring leaders can quickly assess their organization's financial trajectory. The Metrics Scrum Visualization takes it a step further, presenting a split-screen format where advancing metrics appear on the right and declining metrics on the left, complete with current vs. previous values for easy trend comparison. This agile approach empowers teams to move beyond reactive analysis and engage in proactive financial planning.
By embracing a dashboard-driven workflow, healthcare executives can translate structured claims data into real-time insights, fostering faster decision-making, improved alignment between financial and clinical teams, and stronger cost containment strategies. In an industry where margins are tight and efficiency is paramount, this dashboard serves as the ultimate tool for staying ahead of financial challenges while optimizing care delivery.
A monthly metrics scrum combined with a dynamic, actionable dashboard can transform raw claims data into powerful insights that drive decision-making. By continuously analyzing trends, identifying outliers, and making proactive adjustments, healthcare leaders can ensure cost efficiency while enhancing patient care.
In essence, it’s about moving from reactive to proactive management, ensuring that healthcare organizations are equipped not only to face financial challenges but to thrive in an increasingly complex landscape. With the right tools and a culture of data-driven agility, healthcare executives can confidently navigate the path toward sustainable growth and improved outcomes.
Ultimately, this is about creating a smarter, faster, and more resilient healthcare system—one where data doesn’t just inform, but empowers. With the right metrics, tools, and a disciplined cadence of review, healthcare executives can lead their organizations toward sustainable financial health and better patient outcomes.
It’s time to stop reacting and start scrumming the right metrics—turning claims data into actionable strategy through agile, cross-functional collaboration.
In the next article, Tracking What Matters – Advanced Metrics for Smarter Healthcare Finance, we’ll dive deeper into specific metric categories that sharpen cost oversight and drive actionable improvements. Read on to discover the key data points that can transform your organization’s financial performance.
Interested in exploring a real-time financial metrics dashboard? Schedule a quick demo with our experts to see how it can work for your organization.
Join over 3,200 subscribers and keep up-to-date with the latest innovations & best practices in Healthcare IT.
Securing legacy health data integrity using an archival solution isn't just a recommendation anymore; it's …

Duplicate, inconsistent, and incomplete patient records put patient lives at risk and in addition, your …

Healthcare data archival and EHR data migration present healthcare organizations with substantial …